Use SaltStack as a Data Source in Grafana
For visualizing and alerting on your infrastructure and services, Grafana is awesome, and its power gets amplified when dashboards and alerts and be templated to work with your constantly evolving infrastructure. So how do we decide how to apply templates to the right set of servers and services? Well, of course you can preseed key-value pairs on your servers and have your collector agents like Telegraf work off of your seeded data. However, if you are familiar with or favor an externally managed source of record like node groups in Salt, templating in Grafana works a little different.
In my latest personal experience, we chose to use node groups in Salt for defining the role of a server since we have no control over hostnames. Otherwise, this problem is solved already by using a naming scheme for server roles (web4, db1, cache3, lb2-west, etc.).
Grafana comes built-in with support for InfluxDB, Graphite, Prometheus, OpenTSDB, Elasticsearch, and others, but non-traditional options like Salt are absent. Our solution is to create a custom Salt data source in Grafana such that dashboard values can be templated from node group membership.
Salt exposes a REST API to which we can query node groups and node group membership. An important prerequisite to use Salt node groups as a data source is to enable pillar_opts on your master which will expose your master’s configuration as pillar data.
Please be sure you know what you’re doing by enabled pillar_opts on your Salt master. If you have any sensitive data stored in your master’s configuration, it will be readable by all of you minions. Consider moving your sensitive info into something like HashiCorp’s Vault.
To feed Grafana with Salt data, we first need to install the SimpleJson plugin. This plugin is generic and allows you to custom craft your own data source backend. The SimpleJson plugins requires backends to respond to 4 Grafana events: query API, annotation API, search API, and a connection test. Since all we’re doing with the Salt data source is retrieving a list from known keys, we’re only going to fully implement the search API.
I used Bergquist’s project as a starting point and refactored/trimmed it to serve our narrower goal. Thank goodness for his example because I am not a JavaScript developer. In traditional JavaScript developer fashion, however, my code changes are sloppy and I’ll worry about it later.
Start by installing Grafana-Salt-Backend:
$ npm -g install blaketmiller/grafana-salt-backend
A global install isn’t required if you know what you’re doing. I prefer it because I like having things installed in system-default locations. If you included the -g, the project can be found in /usr/local/lib/node_modules/grafana-salt-backend.
Next, you’ll need to configure the app. Right now, the app supports username and password over LDAP for authentication:
{
    "username": "blake",
    "password": "really_secure_password",
    "saltmaster": "saltmaster.example.net",
    "protocol": "http",
    "port": 8000
}
If there’s any traction with this, then perhaps I’ll add token auth, but this works for me right now. I would also happily accept a pull request from someone who enjoys JavaScript more than I do.
Now, run the service in the foreground:
node /usr/local/lib/node_modules/grafana-salt-backend/index.js
To test that the data source is working, try hitting it:
curl -H 'Content-Type: application/json' -X POST -d '{"target": "list"}' http://localhost:3333/search
If everything is good, you should see a list of all your node groups defined in Salt. It is also probably a good idea to run the backend as a service, so let’s put it behind Systemd with /etc/systemd/system/grafana-salt-backend:
[Unit]
Description=Grafana Salt Backend
After=network.target

[Service]
ExecStart=/usr/bin/node /usr/local/lib/node_modules/grafana-salt-backend/index.js
KillMode=process
Restart=on-failure

[Install]
WantedBy=multi-user.target
To have the process start at each system boot, run:
systemctl enable grafana-salt-backend
Next, start the backend:
systemctl start grafana-salt-backend
Now, let’s go configure a new SimpleJson data source:
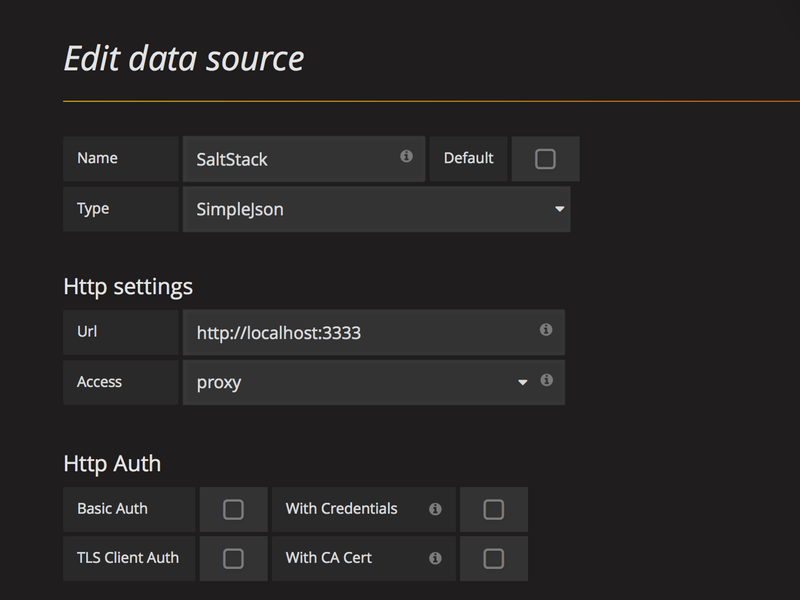
Note that I am running the app on the same server as Grafana, so localhost works for this tutorial, but if you installed Grafana-Salt-Backend anywhere else, make sure to use the correct URL.
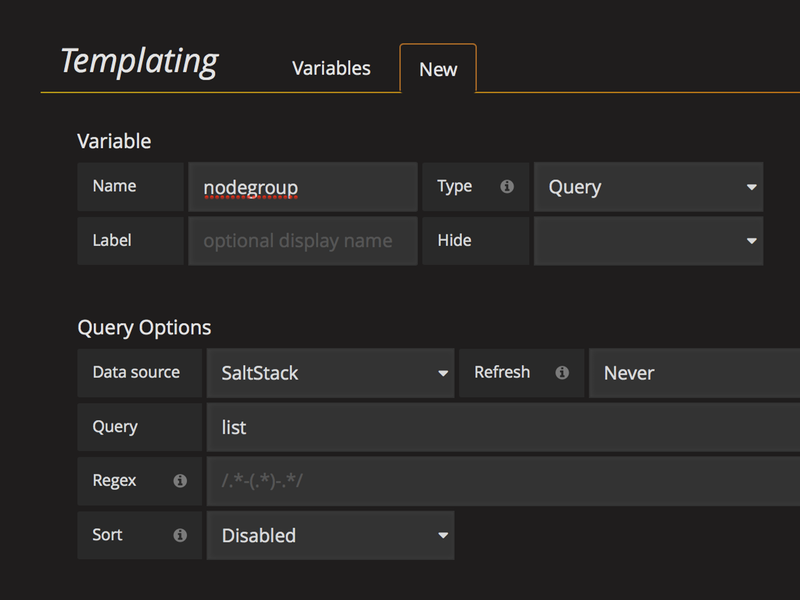
And voila! We are now able to query Salt for node groups! To see it in action go create a new dashboard. We will create two variables. Start by clicking on the gear icon to Manage dashboard and selecting Templating. On the Variables menu, click New. Then, fill out the first variable like:
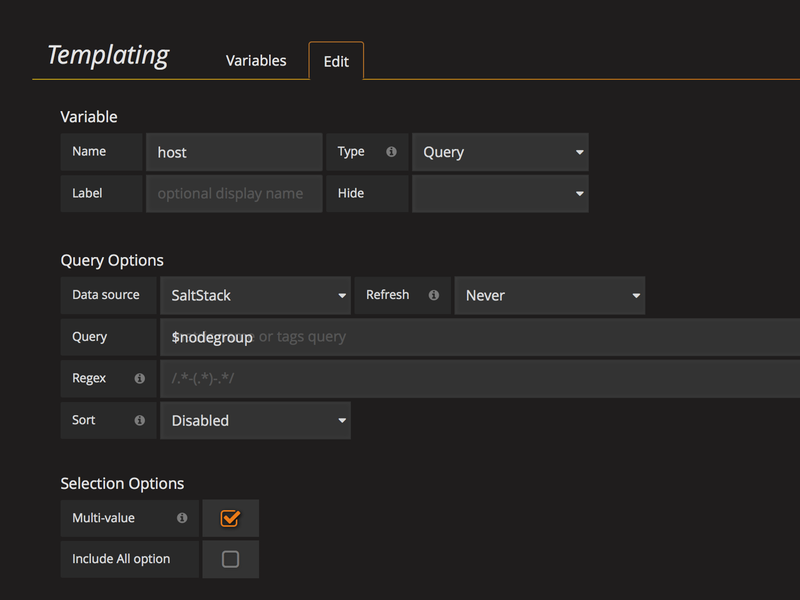
Once done, click Add. We need a second variable, so from the Variable menu again, click New. Then, fill out the second variable like:
Once done, click Add. At the top of the dashboard you should now have two dropdown menus. The first menu allows you to select a node group and the second allows you to select hosts within that node group:
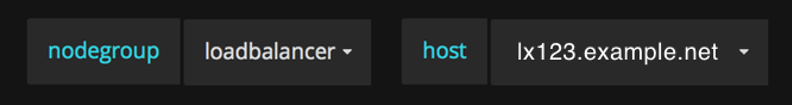
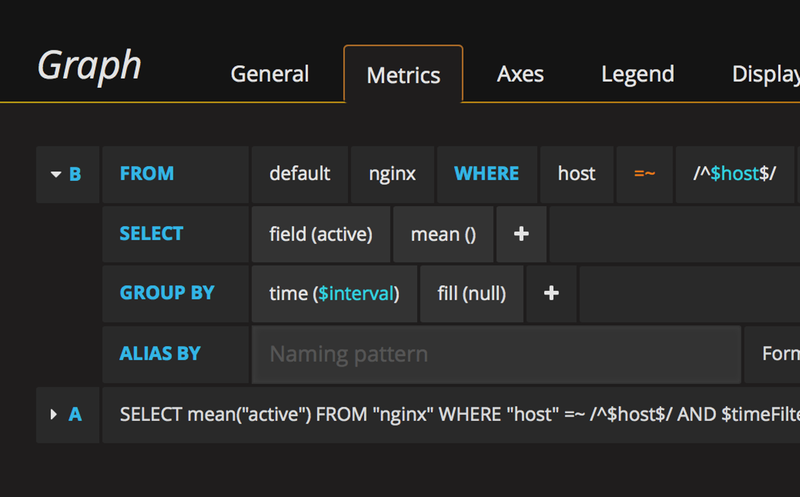
Throughout the template, the variable $host is used to fill in your selected hosts:
comments powered by Disqus